Brain Atlases
- Published1 Jan 2009
- Reviewed25 Sep 2012
- Author Debra Speert, PhD
- Source BrainFacts/SfN
Like detailed driving maps produced from satellite images, the latest maps of the brain allow scientists to explore the nervous system in new ways. These “brain atlases” have become important tools for scientific discovery and are helping scientists address medical issues, from discovering the effect of aging on the brain to improving diagnoses for neurological impairment in preterm infants.
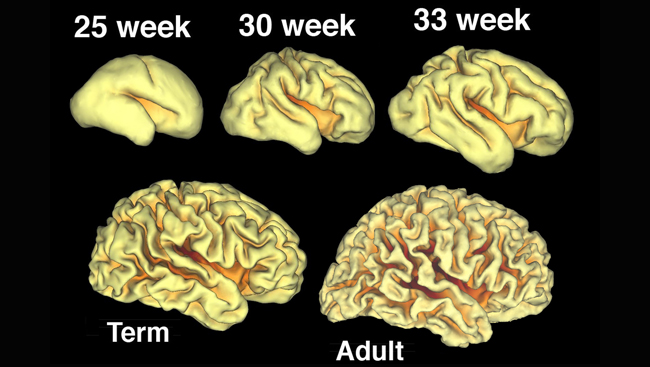
Researchers are gaining a better understanding about brain development by generating maps of the cortical surface in premature infants (shown at several gestational ages), full-term infants, and adults. By comparing cortical folding patterns in preterm infants with neurological, behavioral, and psychiatric challenges to those of infants who develop normally, researchers hope to identify brain signatures of disease.
Intrepid explorers of the 16th century, like Vespucci and Magellan, navigated the earth and communicated their discoveries using colorful but inaccurate maps of the earth’s surface. Today, earth maps are informed by satellite imagery and computer technology and provide exquisitely detailed overlays of many different types of information.
Like map-makers of old, today’s neuroscientists face the challenge of representing new discoveries about the brain. Using new technologies, “brain atlases” allow them to chart unexplored territories and represent complex data.
In much the same way that local maps display the location of landmarks, one type of brain atlas maps the location of genes in the brain. These complex maps are helpful because gene expression patterns — which genes are turned on and off — differ from one region of the brain to another.
Because genes are the basic building blocks guiding the development and function of the brain, understanding gene expression differences may help explain why different regions of the brain have distinct functions. To generate genetic brain atlases, scientists are producing and combining expression maps for the more than 20,000 genes in the genome.
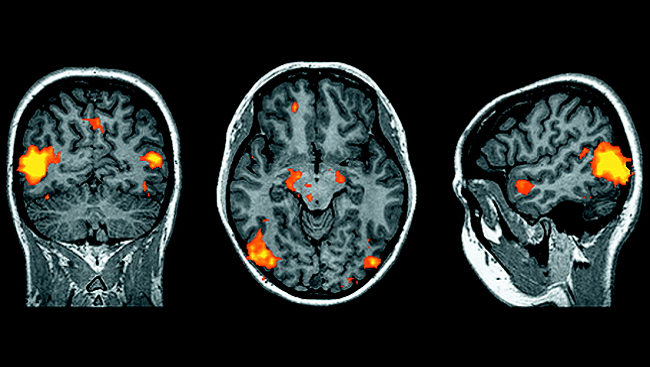
Other brain atlases map previously unexplored brain structures. For example, scientists are now exploring the importance of the complex folding of the cerebral cortex, the outer layer of the brain. Researchers have developed surface maps of the brain using imaging methods such as magnetic resonance imaging (MRI) that show the depth and height of these folds — akin to topographic land maps (“topo maps”). Imaging research has shown that the pattern of folds differs dramatically from person to person. So, researchers have averaged the data from many different individuals to create a population-average atlas.
These new atlases are facilitating both medical and scientific advances. These studies are leading to:
- New insight into normal brain differences and those caused by disease
- Improved diagnoses in premature infants
- Shared resources for scientists
Atlases of gene expression may help identify new ways to combat diseases. Many diseases are caused by genetic problems, such as mutations, and many other diseases affect gene expression, turning sets of genes on or off at the wrong time. Comparing the genes expressed in the diseased brain or spinal cord to an atlas of normal gene expression may help reveal how certain diseases work and suggest new ways to treat or prevent them.
Similarly, by comparing individual brain surfaces to the population average atlas, scientists are identifying how the structure of the cortex differs among people and how it may be disrupted by disease. Ongoing research is testing for cortical differences between men and women and exploring the impact of aging on the brain. Using these same techniques, researchers have also identified cortical folding abnormalities in people with autism, schizophrenia, and Williams syndrome, which are all neurodevelopmental disorders.
New brain atlasing projects may also improve diagnoses for preterm infants at risk of developing neurological problems. Advances in medical science have improved the survival rates for babies born before 30 weeks of gestation, known as very preterm infants. However, many of these children face medical challenges: 30–60 percent experience cognitive impairments, including learning disabilities, visual-motor problems, and impaired memory, or developmental disorders such as attention-deficit hyperactivity disorder, autism, and schizophrenia.
How does brain development in the womb differ from brain development in the neonatal intensive care unit of a hospital? To find out, researchers are generating brain atlases of preterm infants at several key time points in early development. By imaging over one hundred children, many of them several times over the course of several years, these researchers will be able to construct movies of individual brain development.
By comparing cortical folding patterns in preterm infants with neurological, behavioral, and psychiatric challenges to those who develop normally, the researchers hope to identify brain signatures of disease. These biomarkers may help diagnose at-risk children before complications arise, when early intervention may reduce the severity of disease.
Researchers also use brain atlases to help design better experiments and compare the results of different studies. Laboratories use a variety of procedures to acquire, analyze, and represent data. This often creates a problem, because each laboratory’s data may be acquired with slightly different methods and “speak a different language.” The problem is reduced when researchers plot their data on the same maps — effectively translating them to the same language. In this way, data collected by different researchers can be directly compared, and data collected by one researcher can be shared and searched by others, stretching research dollars and helping prompt new collaborations.
From detailed maps of the cortex to improved medical treatment for preemies, brain atlases are impacting scientific discovery and medical intervention. Like Vespucci’s maps, these new atlases communicate our current depth of knowledge — how much we have learned — and yet also further illustrate just how much there is left to discover.
About the Author
Debra is the former director of public information and outreach at the Society for Neuroscience and oversaw content production for BrainFacts.org. While completing a PhD and postdoctoral fellowship in neuroscience, she discovered a knack for explaining tough scientific concepts to general audiences.
CONTENT PROVIDED BY
BrainFacts/SfN